This site uses cookies to improve your experience. To help us insure we adhere to various privacy regulations, please select your country/region of residence. If you do not select a country, we will assume you are from the United States. Select your Cookie Settings or view our Privacy Policy and Terms of Use.
Cookie Settings
Cookies and similar technologies are used on this website for proper function of the website, for tracking performance analytics and for marketing purposes. We and some of our third-party providers may use cookie data for various purposes. Please review the cookie settings below and choose your preference.
Used for the proper function of the website
Used for monitoring website traffic and interactions
Cookie Settings
Cookies and similar technologies are used on this website for proper function of the website, for tracking performance analytics and for marketing purposes. We and some of our third-party providers may use cookie data for various purposes. Please review the cookie settings below and choose your preference.
Strictly Necessary: Used for the proper function of the website
Performance/Analytics: Used for monitoring website traffic and interactions
Can anything make a project manager’s heart sink faster than being told that they need to give a project presentation to the board of directors? If you haven’t come across these presentation requests from senior managers yet, you will! What Is a Project Presentation? A formal project presentation requires good data.
So you have to do a presentation at work? Presenting in meetings or to your boss is always a bit nerve-wracking and yet it’s a critical part of project communications. Here are 10 tips for giving a fantastic work presentation. Who are you presenting to? Are you giving a presentation in a meeting room?
Thanks to its collaboration features, Google Slides is one of the best tools for making basic timelines online and presenting them to stakeholders during project or business meetings. Businesses can also use this timeline to summarize major milestones in a strategic or business plan, which is ideal for executive presentations.
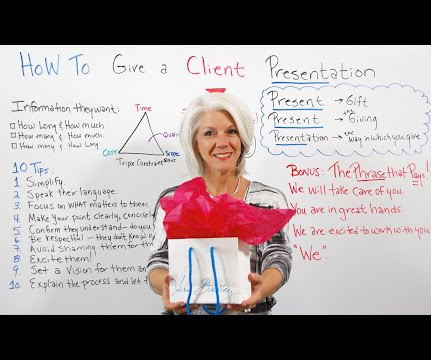
Think of the word “Present- ing” and consider your clients: they want you, the expert, to provide them with the information they want and need. What Is a Client Presentation? A client presentation allows you to explain the importance of your work in a compelling way. A client presentation is all about communicating.
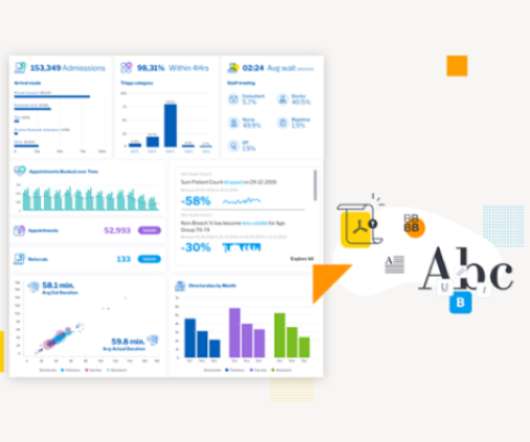
Organizations look to embedded analytics to provide greater self-service for users, introduce AI capabilities, offer better insight into data, and provide customizable dashboards that present data in a visually pleasing, easy-to-access format.
As you grow in your project management career, you’ll be called upon to make various presentations. However not all presentations are the same. Presentations to senior executives can be very different than presenting project information to peers. This is different to how you would present to your peers.
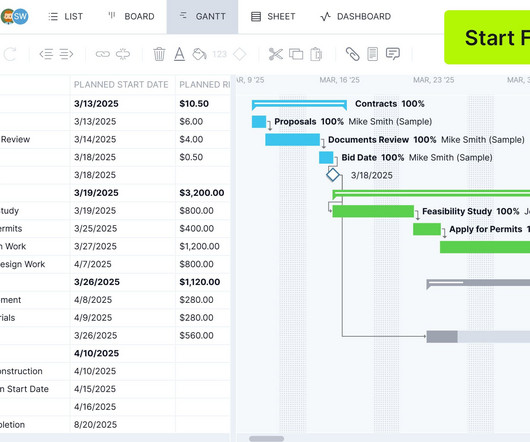
Google Slides is a tool designed for making presentations that allows collaboration with team members online. This free Gantt chart template for Google Slides is ready to utilize for any project management presentation. Why Make a Gantt Chart in Google Slides? It will help you make a Gantt chart in Google Slides in minutes.
Look for a chapter near you, or simply volunteer to present to groups at work. Another important skill is public speaking – Toastmasters is a great way to improve. Your next steps Projects are a big responsibility and may seem overwhelming at times.
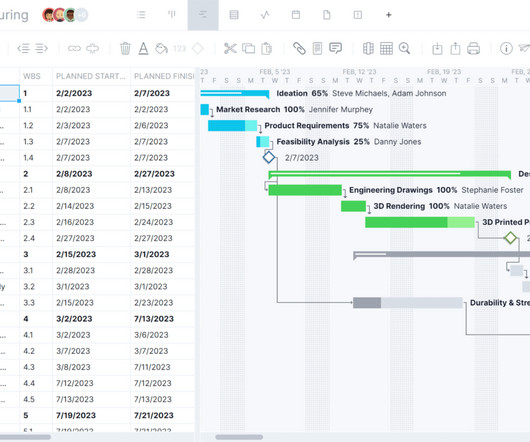
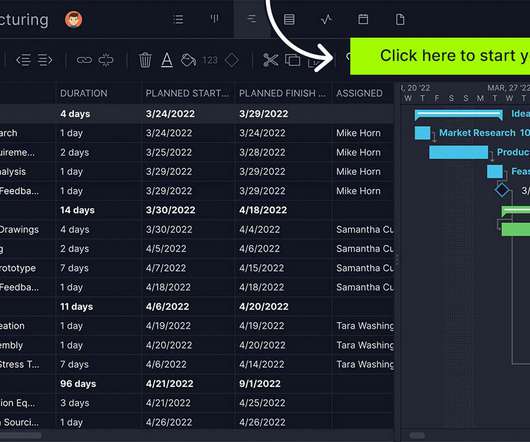
ProjectManager’s Gantt chart is ideal for making timelines for workflows and projects Learn more While PowerPoint may not be the software organizations need for managing projects, it’s still ideal for making simple timelines for project management presentations.
Embedding dashboards, reports and analytics in your application presents unique opportunities and poses unique challenges. We interviewed 16 experts across business intelligence, UI/UX, security and more to find out what it takes to build an application with analytics at its core.
Why you need to think visually (even if that is not your style), and easy tips to make your presentations look more professional. How to set up a simple plan for capturing and acting on lessons learned. How to confidently go into your meetings and get to a good resolution. How to make the most of your time and supercharge your productivity.
If a project has a cost-benefit ratio of greater than 1,0, the project is expected to deliver a positive net present value. If you want to, it can help if you present the information to the organization. This cost-benefit analysis can determine if the project’s benefits outweigh its costs. Everyone needs to know.
If you face a problem this year you should present the issue along with your solution or recommendation. We have uncovered an issue but When something goes wrong you should fess up as soon as possible. However, senior stakeholders like it when you can tell them what you are doing about the problem. Projects are gonna project.
Integrating More Technology Certainly, the biggest paradigm shift presently is the introduction of artificial intelligence (AI)-powered decision-making. Plus, clearer performance tracking improves transparency and accountability for both team members and stakeholders.
In this blog, we explore 5 key principles that exist to ensure you create a relevant dashboard that guides and simplifies the user experience, makes it as easy as possible to interpret what is presented no matter its complexity, and increases the adoption of BI.
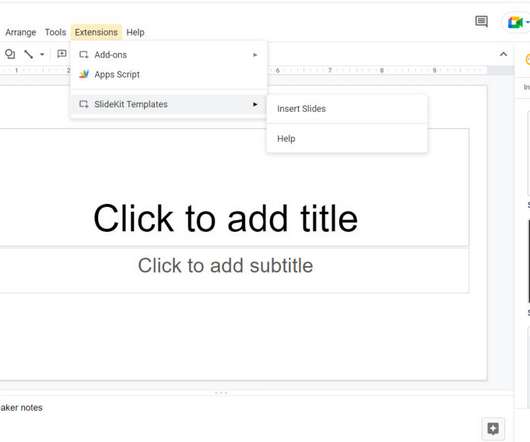
It can make creating decks so much easier, and we all know how much senior execs like a good presentation. So will SlideKit’s Google Slides templates make it easier for you to create impactful presentations more quickly? SlideKit is a huge set of more than 4,500 presentation templates created with Google Slides in mind.
Ultimately, you want to get to a point where the risks that are presented to the Board link tangibly back to what project team members are actually doing. At program level, aggregate risks from all the projects. Above that, produce an aggregated view of portfolio-level risk.
Being able to present your ideas visually helps on slides, reports, presentations and simply when sitting next to a colleague drawing out a concept or plan. That has always been the case, but today, technology makes it even easier for us to pull out the data that’s required and present it in a way that is simple to understand.
First, Acme will create a client brief to present to XYZ. Client Brief Example To better understand how a client brief works, imagine a real-life scenario where Acme Manufacturing is launching a new product. They don’t have a marketing department and want help from a marketing agency, we’ll call XYZ.
This presentation will help leaders to do just that. At the end of this presentation, attendees will be able to: Use employer branding techniques that speak to inclusivity in order to attract talent that fits an inclusive culture.
In particular, the BoK points out that reflective practitioners do not wait for knowledge to be presented to them; they seek it out from learning opportunities that arise during daily experiences and work. Instead, it discusses the need for practitioners to be reflective (section 3.3.6)
Presentation Phase In the presentation phase, the developed ideas and alternatives are presented to the project stakeholders, such as clients, designers, contractors and team members. It may also involve testing or prototyping to ensure the proposed changes can be successfully integrated into the project.
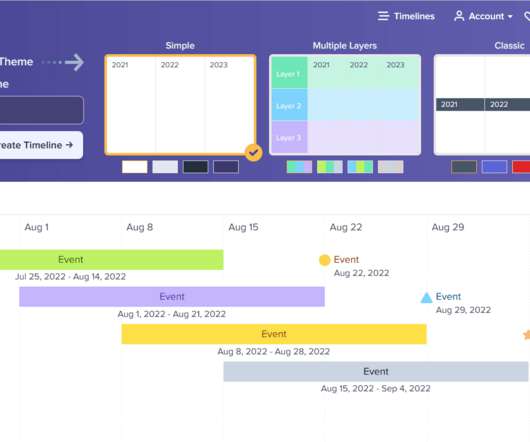
It’s a good choice for project managers and is a useful communication tool for professionals looking to share key dates and events with others in a presentation. Use it to show an overview of the work, present progress to clients and gain buy in from senior stakeholders. Preceden: Overview. Sharing timelines. Why not check it out?
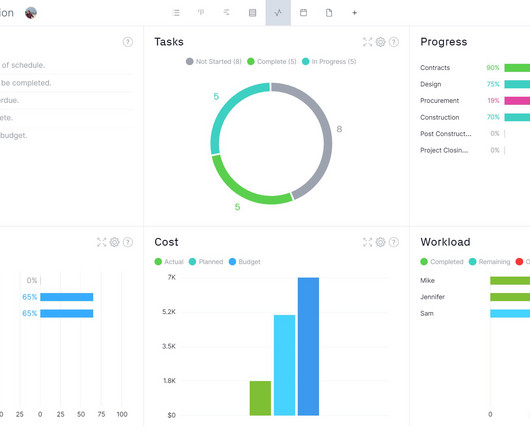
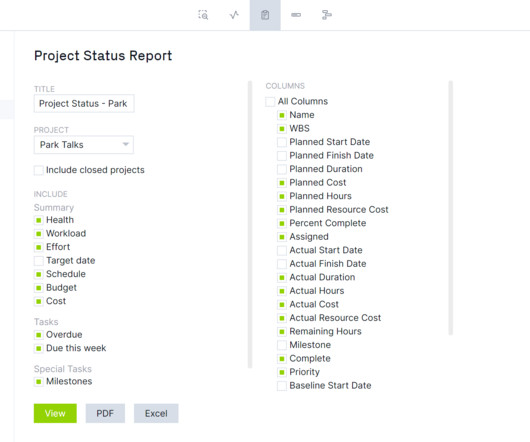
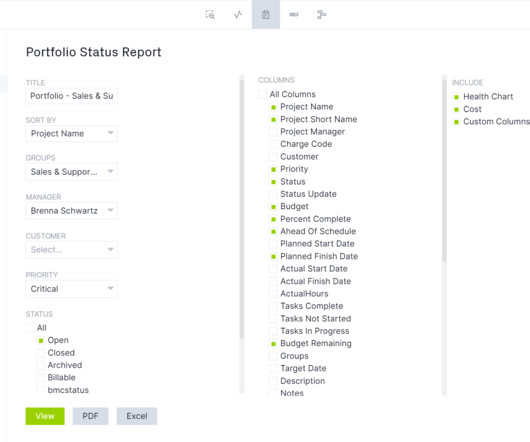
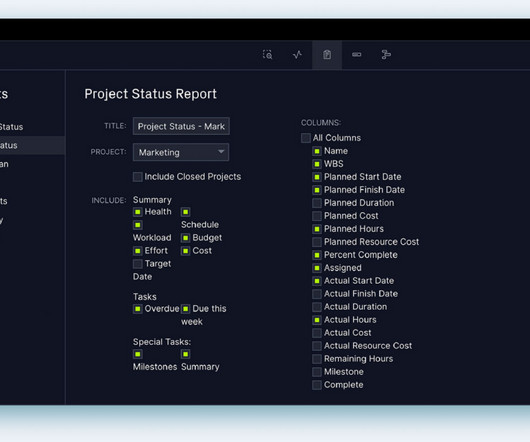
This project portfolio management template improves communication and helps to deliver project update presentations with greater impact by capturing the current status of projects in terms of health and progress.
Speaker: Sandhya Hegde, Director of Product, Amplitude
Present and drive product strategy based on evidence. Whether you are building new features, trying to improve customer experience or battling poor retention - user behavior forms the foundation of your product strategy. In this webinar you will learn the best practices on how to: Explore & understand the full customer journey.
The framing effect is a cognitive bias that can lead us to make different decisions based on how information is presented to us. Framing occurs when people identify the key issues in a situation and then present them in a way that will influence the decision that is made. The way you present a statement shapes how people respond to it.
From that you can calculate the return on investment (ROI), internal rate of return (IRR), net present value (NPV) and the payback period. What Is the Net Present Value of the Project Options? There’s a list of every project expense and what the benefits will be after successfully executing the project.
Delineate the topics or issues to address in your notebook or/and the presentation. It’s important to think about what could impact the meeting or your presentation and be ready to go in a different direction if necessary. Check for the presentation twice (share it with someone else to see if it’s clear and easy to follow).
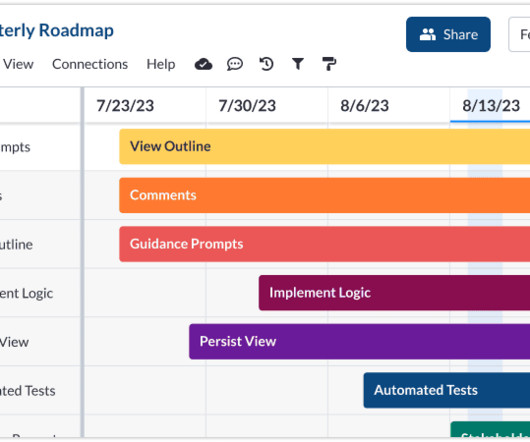
Next, get yourself a Visor account : Visor adds a presentation layer (it’s much more than that in reality, but think of it as that for now). Add extra data Jira does have a roadmap tool, but if you want to add context and notes just for presentation purposes, it’s tricky. They don’t need to know how to use Jira.
Speaker: Amanda Stockwell, President of Stockwell Strategy
Join Amanda Stockwell, President of Stockwell Strategy, as she presents common issues agile teams have with incorporating research, and how to solve them. Using the right strategy, your agile team will collect qualitative data, interpret it, and integrate it effectively. In this webinar, she'll make specific suggestions around: Team makeup.
Product Definition Scrum thrives in environments with cross-functional teams, where every skill needed to deliver the product is present within the team. This book presents 74 Scrum Myths, each revealing truths about the framework. Frameworks like Nexus are a simple way to help with this without adding unnecessary overhead.
An effective project manager also communicates in a variety of ways including: Written e.g. newsletters, reports Verbal e.g. presentations Nonverbal (although you won’t necessarily be conscious of this all the time!) Video (recorded or live) and more.
I always encourage managers to present budgets as a range , because single point estimates often trap you into a certain mindset where there is no scope for change, whatever the reason. So, we present it as what it is: our best estimate based on all the knowledge, information and professional judgement available to us.
Present a Business Case. When you present this to the stakeholders they now have a summary to distribute or present when approached about other projects, so they can focus their resources where they’re needed. Then you present your charter, and once it’s approved and signed, the real work begins.
Speaker: Marius Moscovici, CEO Metric Insights & Mike Smitheman, VP Metric Insights
This presentation will provide a practical step-by-step guide for implementing effective BI governance and a toolkit for addressing the three critical aspects of any program: People - Roles and responsibility in the governance process. To be effective, Business Intelligence (BI) governance must cover both data and visualizations.
Net Present Value. Net present value is about investing in projects that have a positive net present value and avoiding those with a negative net present value. This accounts for the time value of money, meaning future money is less valuable than presently available capital.
Return on investment Payback period Net present value Strategic alignment Expected effort Potential benefits Resource availability Potential risks Customer impact Eisenhower Matrix or Project Prioritization Matrix This simple but effective tool was popularized by US President Dwight D. Examples of criteria are as follows.
Net Present Value When looking at the net present value of a project, you’re viewing the excess of cash inflows beyond cash outflows, adjusting both streams for the time value of money. Internal Rate of Return Use this capital budgeting technique to find the discount rate that’ll bring a project’s net present value to zero.
Unlike a risk, which is an event, both positive and negative, which might occur, an issue is presently impacting the project for the worse. Issue Tracking Template Another software development template that helps to keep work moving smoothly is our free issue tracking template for Excel. The issue must be resolved.
Speaker: Ketan Jahagirdar - Sopheon’s Director of Product Management
During this webinar, we’ll cover the following: Three Critical Metrics: Net Present Value (NPV), Internal Rate of Return (IRR), and Payback Period Why tracking capital spend is important How project spend classification shapes the portrayal on an income statement Classification of capital expenditure (CapEx) versus.
Present the overall roadmap, for example, a timeline for the 5 year plan. They can bring in team members to present specific topics if that would help, and if their expertise is needed as part of the debate. Present the budget figures related to the area and the confidence levels around meeting those. 10am: Big picture strategy.
This process can be broken down into five phases: information, creative, evaluation, development and presentation. The team should present their ideas and describe the advantages and disadvantages of each. Presentation Phase. The team now presents its winning solutions to management and stakeholders. Information Phase.
Session or Activity Schedule Add the titles of all the sessions, presentations, workshops or activities as well as the start and end times of each session or activity. Registration and Check-In Times A clear indication of when registration begins and when check-in closes. Any early bird registration times or deadlines if applicable.
However, it’s worth knowing about especially if you have a big presentation coming up or a difficult meeting to navigate, so you can think through how you want to say your piece. How to use paraverbal communication effectively Here are some tips for making the most of the ‘how’ when presenting information verbally.
We organize all of the trending information in your field so you don't have to. Join 100,000+ users and stay up to date on the latest articles your peers are reading.
You know about us, now we want to get to know you!
Let's personalize your content
Let's get even more personalized
We recognize your account from another site in our network, please click 'Send Email' below to continue with verifying your account and setting a password.


Let's personalize your content