This site uses cookies to improve your experience. To help us insure we adhere to various privacy regulations, please select your country/region of residence. If you do not select a country, we will assume you are from the United States. Select your Cookie Settings or view our Privacy Policy and Terms of Use.
Cookie Settings
Cookies and similar technologies are used on this website for proper function of the website, for tracking performance analytics and for marketing purposes. We and some of our third-party providers may use cookie data for various purposes. Please review the cookie settings below and choose your preference.
Used for the proper function of the website
Used for monitoring website traffic and interactions
Cookie Settings
Cookies and similar technologies are used on this website for proper function of the website, for tracking performance analytics and for marketing purposes. We and some of our third-party providers may use cookie data for various purposes. Please review the cookie settings below and choose your preference.
Strictly Necessary: Used for the proper function of the website
Performance/Analytics: Used for monitoring website traffic and interactions
The balanced scorecard is also a means to measure and provide feedback to businesses and organizations. It’s a common management tool worldwide, used across industries, including government and nonprofit organizations. Norton is a founder and director of the Palladium Group. You can see KPIs, such as time, cost and more.
Mitigating risks related to data confidentiality, integrity, and availability in cloud environments. These assessments must account for: The sensitivity and classification of organisational data. Jurisdictional regulations regarding data storage and processing. Backup, data recovery, and secure storage protocols.
Please find below a transcription of the audio portion of Fletcher Hearn’s session, Project PerformanceMeasurement – Part 1: Overview Of Project PerformanceMeasurements, being provided by MPUG for the convenience of our members. Kyle: Hello, and welcome to part one of MPUGs Project PerformanceMeasurement course.
Please find below a transcription of the audio portion of Fletcher Hearn’s session, Project PerformanceMeasurement – Part 2: What to Measure and How to Report, being provided by MPUG for the convenience of our members. Kyle: And welcome to Part 2 of MPUG’s Project PerformanceMeasurement course.
Is it challenging to navigate the complex landscape of project governance frameworks? In this article, we will dive deep into organizational and project governance and systems in project management. At the heart of this lies the robust framework of Organizational Governance Systems.
Project Governance. Integrated Master Plan: The Foundation of Program Success , College of Performance Management, May 21, 2014. The Nine "I's" of Program Success ," College of Performance Management. Project Performance Management. Building a Credible PerformanceMeasurement Baseline. Project Breathalyzer.
Cost Estimation The process of estimating project costs is done by leveraging historical data, expert judgment, or quantitative models. Earned Value Management (EVM) A systematic approach to project performancemeasurement assessing schedule and cost performance. Six Sigma A disciplined, data-driven (i.e.,
Once a current performancemeasure has been determined, you can define your ideal situation based on meeting or surpassing standard requirements. Next lay out a clear framework that will take you from your current performance to your ideal situation, potential. Measure current process performance.
Technical PerformanceMeasures (#TPM). Cost, Schedule, and Technical Performance Management (#CSTPM). Governance (#Governance). Managing Government Grant Projects at Arizona Public Service - APS management process for Department of Energy grant for algae CO2 capture project. Project Performance Management.
It enables knowledge workers to do their jobs efficiently via tools such as spreadsheets, presentation software, bookkeeping tools, data processing tools, calculators, etc. . Remote teams, employees, and resources also need proper technological support for delivering the best performance. Is new technology hurting our productivity?
The only answer to that is a measure of Physical Percent Complete (P%C). P%C starts with defining the Measures of Performance and Technical PerformanceMeasures for each deliverable as a function of time. These measures are supported by Quantifiable Backup Data. Resources .
I work in a domain where the CoU is baked into the Integrated Program Performance Management (IPPM) processes flowed down from the buyer, in this case, the Federal Government. The CoU paradigm defines the needed reduction in uncertainty is some performance metric. There is NO data needed to use the CoU.
I myself found that at both a major bank and a major government department, project managers were re-baselining their projects every week, and when I asked why, their answers essentially were, “Just because we can.” Ellen clarified: “Do you re-baseline your entire project every week?” “Yes” Yes” was the emphatic answer.
Comparing benchmarking data is often difficult to do if the two companies have very different project management cultures. Identification of governance and leadership effectiveness. Therefore, it will be necessary to benchmark the metrics use as part of performancemeasurement. Identification of business opportunities.
Prerequisites for portfolio management In the first article, Steve Butler delves into portfolio governance. The primary goal of governance in portfolio management is to ensure that processes are established to define, align, authorize, and control portfolio elements, while also supporting overall governance decision-making activities.
If the IMP is being prepared as part of a proposal, then the Request for Proposal (RFP) and RFP attachments will be the primary documents to define the work to be performed. The RFP normally includes a Statement of Work (SOW) and Contract Data Requirements List (CDRL) that are invaluable in determining the scope of the IMP.
Embedded systems, data processing, image processes, web interfaces, backend databases, networking of collections of devices on the ground and in the air, training systems, logistics systems, maintenance and testing systems. There are several partitions of this information that are common in building the PerformanceMeasurement Baseline (PMB).
The data and statistics below are sorted into categories so you can quickly skim to find the information you need. Government – Federal. Government – City/State/Local. 77% of companies use project management software, and 87% of high-performing companies use project management software. [5]. Re-entering lost data: 45%.
Reductionism must be replaced by emergence where the complex system of data and processes and the sum of the pieces and parts provides a deeper insight into the functions of the system. Earned Value Management (EVM) often anchors such a performancemeasurement system in DoD programs.
Continuous performance assessment by measuring the right thing. Real-time” performancemeasurement as a natural artifact of agile processes. One of the successful teams developed a data storage system for Northrop Grumman’s B–2 bomber. If we hadn’t made a big fuss, this would have died a natural death."
However, with this reliance comes the inherent risks of cyber threats, data breaches, and operational disruptions. It encompasses the identification of potential vulnerabilities, threats, and the potential for unauthorized access to critical systems and data.
We play this role in ERP acquisitions for commercial and government clients . Past Performance is the 1st question - have you done this before and if so, were your efforts successful? What is data and process workflow is exchanged between each Capability? What are the Technical PerformanceMeasure for each of those deliverables.
The Cone of Uncertainty as a Technical PerformanceMeasure. Of late, Cone of Uncertainty has become the mantra of No Estimates advocates claiming that data is needed BEFORE the Cone is of any use. Redefining the meaning and then arguing my data doesn't match that is a poor start to improving the probability of project success.
Similarly, product lifecycle management (PLM) integrates people, data, processes and business systems. This notion shows that governance is not considered a requirement for the business. This AoA requires making estimates of the input data since it is probabilistic and the outcomes since they are probabilistic.
Drawing Unsupported Conclusions from Incomplete and Inconclusive Data, it is not only natural but also laudable, to seek evidence that confirms something that we hold to be true. We can estimate the total cost, total duration, and the probability that all the Features will be delivered on the program we are working for the US Government.
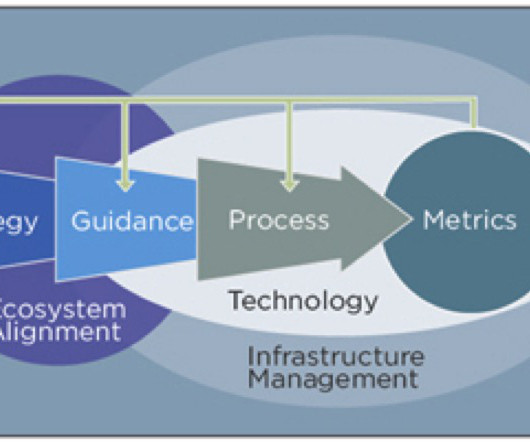
This applies not only to messaging, but also to your strategic plans, tactical plans, process designs, people, tools, performancemeasurement – really, everything that Marketing does. This is also known as governance or guidance. Always start with WHO.
Dual buffer representation in Epicflow Understanding History to Plan for the Future Understanding the dynamics of capacity buffers to plan the future is incomplete without considering the historical performance of your teams. Informed by historical performance, adjustments can be made to align with actual output trends.
Dual buffer representation in Epicflow Understanding History to Plan for the Future Understanding the dynamics of capacity buffers to plan the future is incomplete without considering the historical performance of your teams. Informed by historical performance, adjustments can be made to align with actual output trends.
Without knowing what Done Looks Like, in units of Measures of Effectiveness and Measures of Performance. Technical PerformanceMeasures (TPM) - are defined at the start of a program—the planned progress of selected technical parameters. MOPs can be accumulated to assess a MOE that is not directly measurable.
- How much variance reduction needs to take place - in any and all the project attributes (risk, effectiveness, performance, cost, schedule - shown below) at what points in time, to increase the probability of project success. The Cone is NOT the result of the project's past performance. When you hear. . Resources. [1]
This is the paradigm of the Cone of Uncertainty - it's a planned development compliance engineering tool, not an after the fact data collection tool. The Cone is NOT the result of the project's past performance. This is a closed loop control system for managing the program with a T echnical PerformanceMeasure (TPM).
risks that may prevent the end item from performing as intended or not meeting performance expectations. Measures of Effectiveness, Measures of Performance, Technical PerformanceMeasures, and Key Performance Parameters describe the measures of these expectations. Programmatic ?
This is a closed loop control system for managing the program with a T echnical PerformanceMeasure (TPM). There can be cost and schedule performancemeasures as well. And as the program proceeds the variances measures on those items move toward compliance of the target number in this case Weight.
Meaning to say creating value, organizational governance and systems, functions associated with projects, the project environment, and product management considerations all provide the context for how project management could be conducted. Unbiased, reliable data. But it’s also got to be actionable data, right?
- How much variance reduction needs to take place - in any and all the project attributes (risk, effectiveness, performance, cost, schedule - shown below) at what points in time, to increase the probability of project success. The Cone is NOT the result of the project's past performance. When you hear. .
System One is an unconscious system that is automatic, fast, efficient at using the data or experience it already knows. The business draws upon microeconomic data to make a variety of critical choices – any one of which could mean the success or failure of their enterprise. System One - automatic. System Two - deliberative .
That means the system architecture, the process flow, the data flow architecture components all how NO dependencies on other. Data and Process Independence might be a goal, but even then the reality of a complex system like Health Insurance is simply not a set of Independent set of User Stories assembled into a system.
The Triangle Distribution is used as a subjective description of a population for which there is limited sample data, and especially where the relationship between variables is known but data is scarce. A common distribution of probabilistic estimates for cost and schedule random variables is the Triangle Distribution.
The time average of task completion delay (for the Whole Project) will always be higher (data suggests ~60%) than the ensemble average single task averages) because (at least) ensemble average delays downplays #Blackswans. The 2008 mortgage crisis for example (although many did an made lots of money), the government didn't.
The reason for this is that the "data" from which the economic calculus starts are never for the whole society "given" to a single mind which could work out the implications, and can never be so given. First some questions: Is the economic data for the project available in a single mind? probably not.
Analogous Estimating : Analogous estimating, describes a technique for estimating the cost or duration of an activity or project based on historical data from similar activities or projects. Audit: The process of analyzing a project to ensure that it is being governed as intended. A project sponsor can request an audit.
That means the system architecture, the process flow, the data flow architecture components all how NO dependencies on other. Data and Process Independence might be a goal, but even then the reality of a complex system like Health Insurance is simply not a set of Independent set of User Stories assembled into a system.
Unrealistic performance expectations missing Measures of Effectiveness and Measures of Performance. Defining the Measures of Performance, the resulting Measures of Effectiveness, and the Technical PerformanceMeasures of the resulting project outcomes is a critical success factor.
System One is an unconscious system that is automatic, fast, efficient at using the data or experience it already knows. The business draws upon microeconomic data to make a variety of critical choices – any one of which could mean the success or failure of their enterprise. System One - automatic. System Two - deliberative .
We organize all of the trending information in your field so you don't have to. Join 100,000+ users and stay up to date on the latest articles your peers are reading.
You know about us, now we want to get to know you!
Let's personalize your content
Let's get even more personalized
We recognize your account from another site in our network, please click 'Send Email' below to continue with verifying your account and setting a password.


Let's personalize your content