This site uses cookies to improve your experience. To help us insure we adhere to various privacy regulations, please select your country/region of residence. If you do not select a country, we will assume you are from the United States. Select your Cookie Settings or view our Privacy Policy and Terms of Use.
Cookie Settings
Cookies and similar technologies are used on this website for proper function of the website, for tracking performance analytics and for marketing purposes. We and some of our third-party providers may use cookie data for various purposes. Please review the cookie settings below and choose your preference.
Used for the proper function of the website
Used for monitoring website traffic and interactions
Cookie Settings
Cookies and similar technologies are used on this website for proper function of the website, for tracking performance analytics and for marketing purposes. We and some of our third-party providers may use cookie data for various purposes. Please review the cookie settings below and choose your preference.
Strictly Necessary: Used for the proper function of the website
Performance/Analytics: Used for monitoring website traffic and interactions
What is parametric estimation? Parametric estimating is a form of project estimation that works for time, resource and cost estimates. It uses parameters (characteristics) to create estimates based on what you already know, so in that respect it’s useful for a project manager because it’s reliable.
Project cost management software is a tool designed to help project managers and teams plan, estimate, budget and control costs throughout the project life cycle. Cost management is a cornerstone of project management and touches on resource management, cost control, cost estimating and much more.
While construction general contractors can use Acumatica’s enterprise resource planning (ERP) software to manage operations, they’ll need integrations to share construction project data. It isn’t, however, a tool equipped to manage complex schedules, allocation of resources and data on tasks. This can be done with integrations.
Construction crews can log hours on the job site, which means that general contractors are always viewing the most current data. Estimated Project Cost: The total amount for all the costs that the contractor will cover as the construction project is built. WIP reports can also help cost management and control.
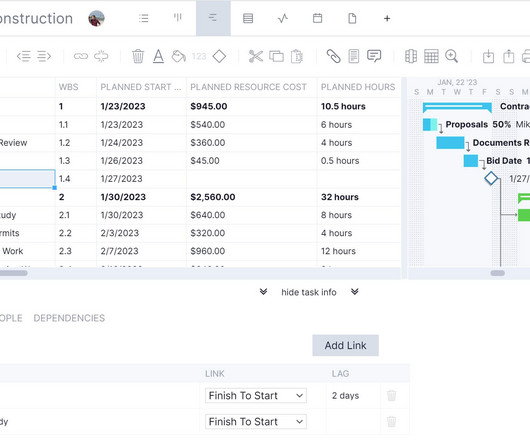
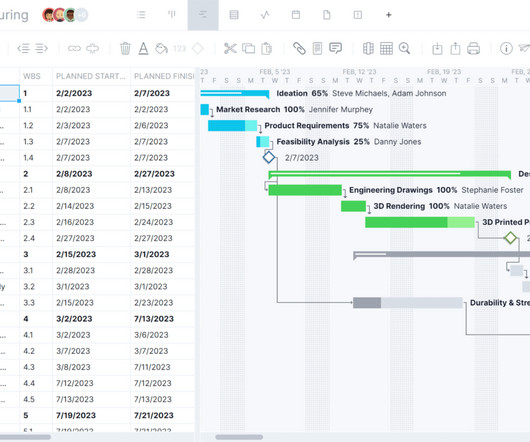
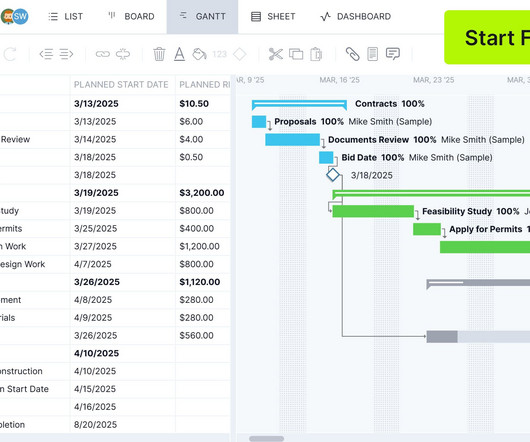
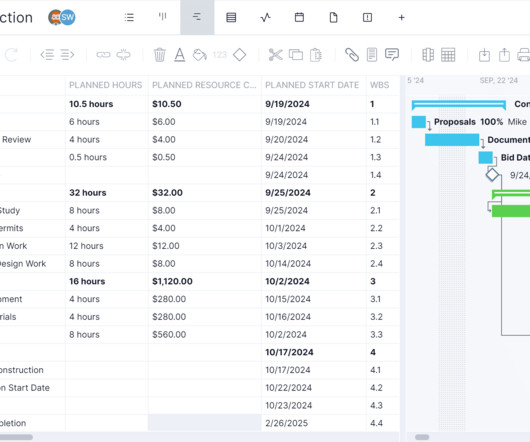
Archiving timesheets gives managers historical data on labor costs that can help better estimate time and costs for future projects. Most timelines are made with Gantt charts , which are divided into two parts: a spreadsheet with the data collected on the left and a timeline showing the entire project on the right.
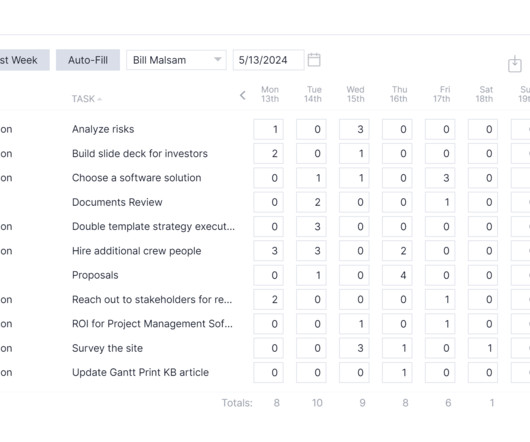
It collects all the pertinent information needed to streamline that process, from the personnel data, such as the employee’s name, department, supervisor and hourly rate. Job Estimate Template There are many angles by which to approach resource management. The work breakdown structure is divided into two sections.
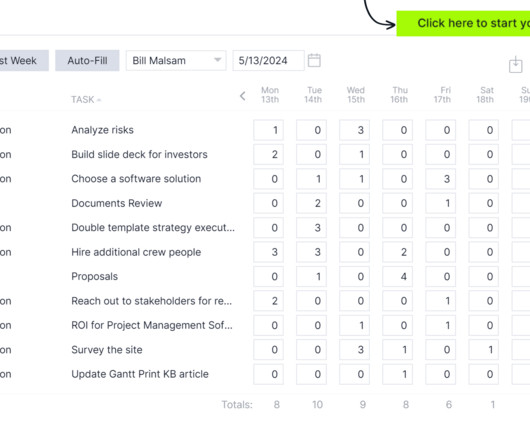
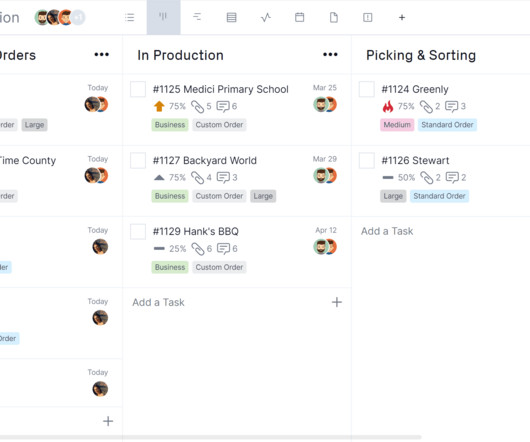
This free Google Sheets to-do list template helps team leaders such as project managers or business managers assign tasks to their team members and track their percentage of completion, priority level, estimated cost and notes. Estimate those costs and compare them against the actual cost of tasks to keep track of budgets.
Make a Project Estimate and Budget Use the work breakdown structure from the earlier step to list all the tasks required to complete the project. Now, estimate the cost of all that work and the associated resources. Project Estimate Template For an accurate forecast of project cost, use this free project estimate template for Excel.
Every project, regardless of the industry, uses a methodology to estimate time and cost to better plan projects. In the life sciences, engineering and construction industries, the method often used is called parametric estimating. Parametric estimating is often used as it’s reliable. What Is Parametric Estimating?
There is then a column for the start and end dates and another that estimates the task duration. Tasks are shown as a task bar that is as long as the estimated duration, from the start date to the end date. Estimate Task Duration and Set Due Dates The next set is to estimate the duration of each task.
Better estimates lead to better projects. This is where an estimate template can help set a project up for success. Download these free estimate templates to deliver projects on time, within budget, and according to stakeholders’ expected quality standards. For that, download this free job estimate template for Excel.
A successful project starts with a successful estimate. All of these considerations are part of project estimation techniques. Estimation techniques are helpful for making decisions on the viability of your project. What Are Project Estimation Techniques?
A statistical model for estimating isn’t normally something I’d put in the ‘make my job easy’ box, but I might just have found one that works. He’s taken the PERT (Project Evaluation and Review Technique) estimating approach to the next level by letting you add a dash of professional judgement in with the numbers. OK, I get it.
Rough order of magnitude (ROM) can help you better estimate project costs. But what is ROM and how can you calculate ROM estimates? We’ll explain the process, define the term and detail the steps for making a rough order of magnitude estimate. As noted, the rough order of magnitude is a technique to estimate project costs.
Real-time project and portfolio dashboards give a high-level overview to analyze project data and share it with subcontractors. Users will appreciate the benefits of pre-planning design, estimating and scheduling features. Those who have used the software complain about the estimating features. 5 Capterra review: 4.4/5
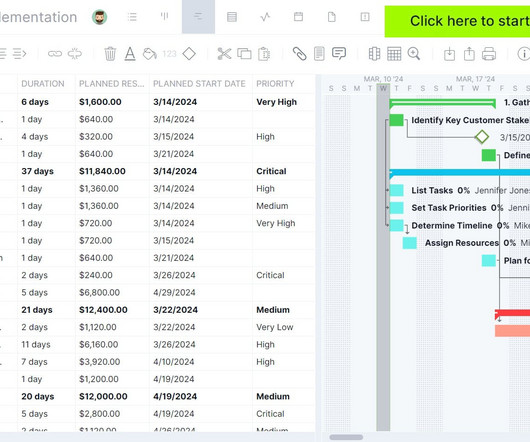
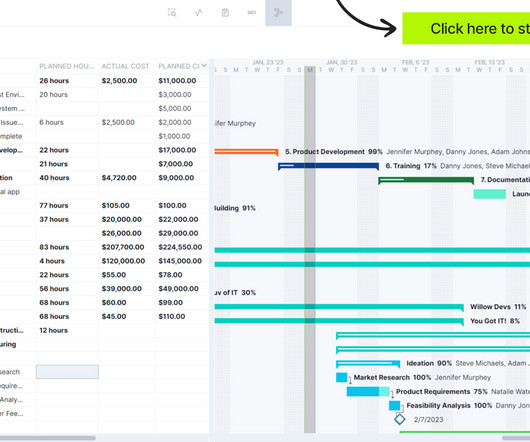
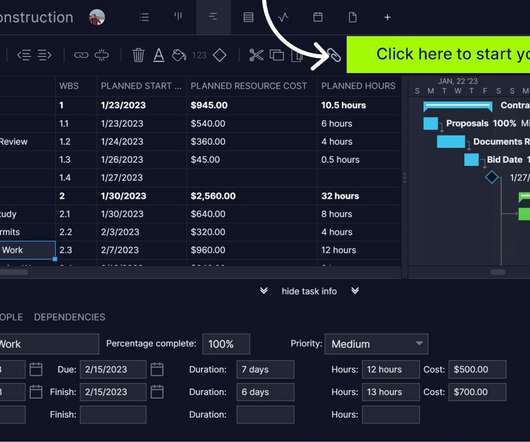
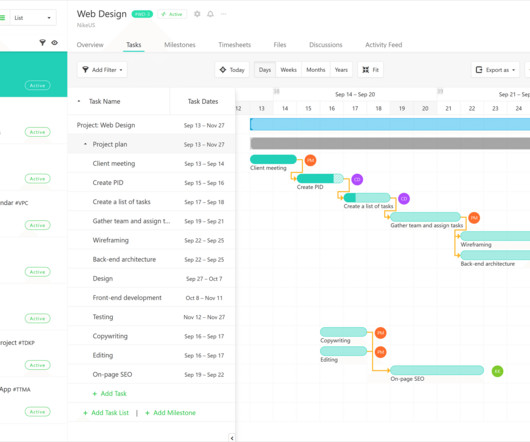
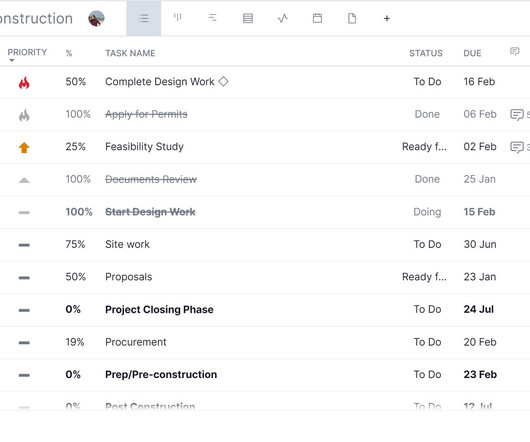
Simply choose the Gantt chart view and begin to enter task information such as expected duration, start and end date, assignee and estimated cost. This data is also recorded in timesheets and reports. This data can then be visualized on real-time data project dashboards which show timeline, budget and workload management information.
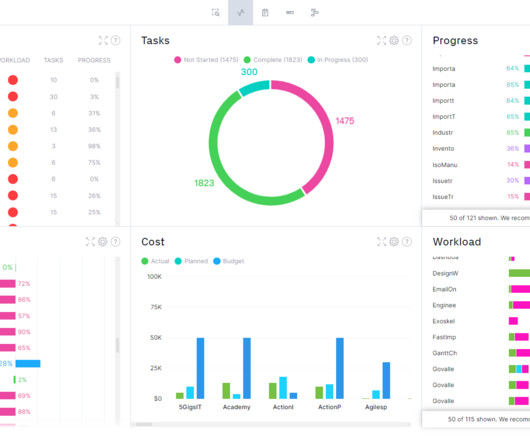
The data is never current, which makes it harder to allocate resources and ensure that projects are delivering on the strategic goals. ProjectManager is award-winning project and portfolio management software with portfolio dashboards that deliver real-time data automatically. Get started with ProjectManager today for free.
In this article, I’ll explain what Estimate at Completion is for project managers, how to use it (because there are 4 different ways) and give you examples. Estimate at completion (EAC) in project management tells you how much the project will cost when the work is finished. What is the formula for estimate at completion?
General contractors have to accurately estimate the amount of those items to keep their profit margin. This detailed assessment estimates the cost, time and materials needed to complete the work. Estimators are usually the primary individuals responsible for performing the quantity takeoff. Heres a list of those key players.
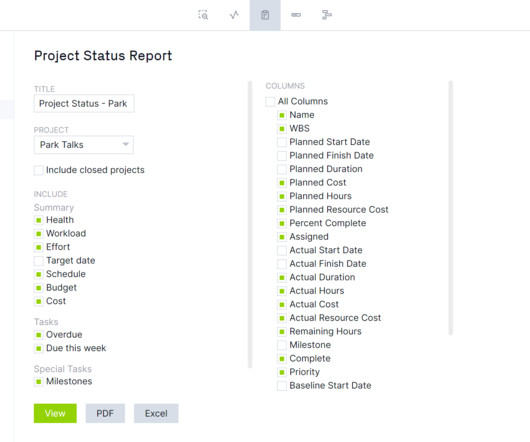
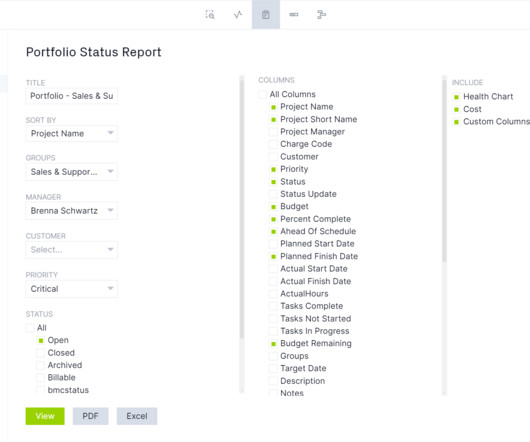
ProjectManager is award-winning project management software that has the tools to plan and track project data through every phase. ProjectManager’s reporting features make it easy to share data during the post-implementation review process. This data can help refine the management of future projects to help teams perform better.
All these benefits are instrumental in providing better decision-making through data-driven, accurate financial information and project performance metrics. Robust Cost Estimating Tools When creating a project, users can create a budget and allocate costs to specific tasks on the Gantt chart. 5 Capterra review: 4.1/5
Timelines allow organizations to estimate how long it will take to execute a project, no matter what industry they’re in. This is done by identifying all the tasks that will be executed, estimating their duration and then determining their start and end dates. In this blog, we’ll explain how to create a timeline in PowerPoint.
Filling out the goal-setting template helps to gather the data necessary to make the next, right move. Then, estimate the gap percentage and list the action items to close that gap (including priority, start and end dates as well as required resources). That’s where a free SWOT analysis template for Word comes in.
It’s online software with real-time data that informs better decision-making, fosters collaboration and has email and in-app alerts to keep everyone working better together. Robust Cost Estimating Tools Project budgets are set at the beginning and provide a baseline to manage cost variance when executing the project.
The client will include all the information the agency needs to understand the client’s needs, including the available budget, estimated timeline and other details in the client brief. Make an Estimated Project Timeline There’s enough information now to create a detailed timeline of the project. Then, the agency can decide on the work.
Resource analysis in project management covers resource planning, which is about estimating resource requirements for the project’s life cycle, and scenario planning to prepare for changes in resource availability. Our software gives project managers this data in real time.
Budgeting and Cost Tracking: Construction management software for small contractors needs to create detailed budget estimates based on project requirements, labor, materials and overhead costs. Resources can be allocated for specific tasks with associated costs to better estimate total project expenses based on resource needs.
Project managers use resource tracking to ensure that the project is delivered on time and within budget by using data to optimize resource allocation, mitigate risks, improve project performance and communicate with stakeholders. Then project managers will have the data they need to reallocate resources to keep the project running on track.
Its a learning opportunity, which helps identify issues, gather data and make improvements, as well as mitigate risks by detecting failures early. By running a pilot with a clear plan, businesses and industries can refine their approach, make data-driven decisions and increase the chances of successful implementation when scaling up.
All this work serves the purpose of making more informed decisions by providing data and insights that support better future actions. Project management software helps to gather this data. The amount of funds necessary to deliver the project has been estimated, but costs can spiral out of control when executing the project.
It can be used as a project timeline to estimate the duration of a project and visualize the order tasks will be completed. PERT is an acronym for program evaluation review technique, and a PERT chart is a timeline template that breaks down each task so they can be analyzed to estimate the minimum time needed to complete the project.
They help program managers identify the stages of the project that require the most attention, as well as provide an estimate of the complexity and effort involved. Users add project data from the program and the template creates colorful graphs and charts that make it easy to see program metrics. These are static documents.
Users of decision tree analysis also have to be aware that the accuracy of the analysis depends heavily on the accuracy of the data used. On the other side of the coin, estimating probabilities for chance events can be challenging, especially when data is limited or unknown. Estimate the payoff or consequences (e.g.,
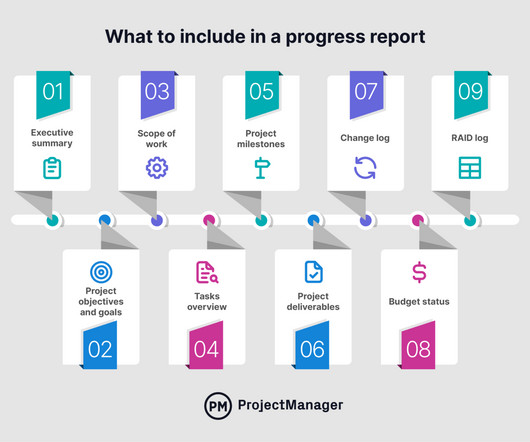
Make a Project Cost EstimateEstimating costs in a construction bid proposal provides the client with a detailed breakdown of the costs involved in completing the project. Theres an executive summary to begin, followed by the scope of work , company information, estimated schedule and costs plus a lot more.
ProjectManagers roadmaps can manage, filter data and highlight key metrics for stakeholders. These submissions typically include a brief project description, objectives, expected outcomes, resource requirements and timeline estimates. Get started with ProjectManager today for free.
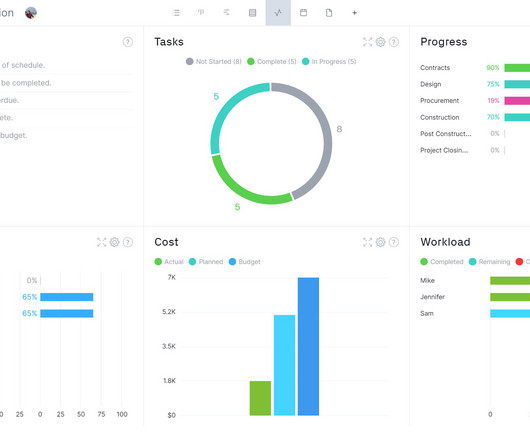
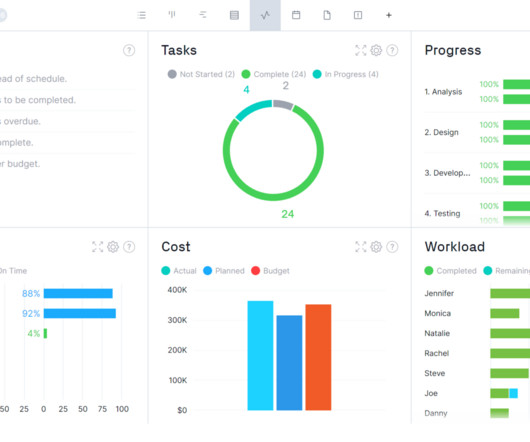
Once a baseline is set on the Gantt chart, a real-time project dashboard is automatically up and running, collecting live data and displaying it on easy-to-read graphs and charts that track time, cost, workload and more. If the import is for an existing project, choose to either update or replace the existing data.
They help project managers compare actual progress against planned progress, identify deviations and make data-driven decisions to keep the project on track. This data will be represented on the vertical (Y-axis) of the graph. Weve formatted it with a chart on the left to capture the project timeline and actual and estimated progress.
Cost Management: Helps monitor and control costs associated with projects or tasks, estimating costs when setting budgets (such as labor, material, etc.) These automatically collect data and display it on easy-to-read graphs and charts that show key performance indicators (KPIs) such as time, cost, workload and more.
A construction dashboard is a digital tool or interface that visually displays key data and metrics related to a construction project in real time. Estimate the Cost of Each Task This is done by adding the labor costs to any nonhuman resources needed for each task. This helps forecast and analyze data.
ProjectManager’s real-time data dashboards are ideal for tracking business processes Learn more What Is Business Process? It tracks and monitors key performance indicators (KPIs) to help managers make data-driven decisions. Six Sigma Six Sigma is a data-driven methodology that focuses on improving process quality.
Data that measure project progress also helps keep team members accountable for their deadlines. Plus, if its online, then its updating with real-time data, so youre not stuck looking at past progress, but where the project presently stands. The cost baseline acts as a time-phased budget that estimates the projects total costs.
It can also improve estimating, deliver projects closer to the planned deadlines and achieve better performance and results. Real-time portfolio dashboards automatically collect live data for a high-level overview of time, cost, workload and more. For example, it helps with selecting, defining and delivering projects.
Time is also important as it estimates duration. The fully customizable free template is designed with specific data included, which can be swapped out to capture the user’s service blueprint. For example, some arrows indicate relationships and dependencies. To get deeper into the details, toggle over to the customizable reports.
Estimate the Potential Benefits and Risks of Your Change Another thing to consider is the benefits of implementing that change and also identifying any risks it might pose to the organization. That is, the change should be harmonious with all departments, teams, processes and systems to work together towards a common goal.
We organize all of the trending information in your field so you don't have to. Join 100,000+ users and stay up to date on the latest articles your peers are reading.
You know about us, now we want to get to know you!
Let's personalize your content
Let's get even more personalized
We recognize your account from another site in our network, please click 'Send Email' below to continue with verifying your account and setting a password.


Let's personalize your content