This site uses cookies to improve your experience. To help us insure we adhere to various privacy regulations, please select your country/region of residence. If you do not select a country, we will assume you are from the United States. Select your Cookie Settings or view our Privacy Policy and Terms of Use.
Cookie Settings
Cookies and similar technologies are used on this website for proper function of the website, for tracking performance analytics and for marketing purposes. We and some of our third-party providers may use cookie data for various purposes. Please review the cookie settings below and choose your preference.
Used for the proper function of the website
Used for monitoring website traffic and interactions
Cookie Settings
Cookies and similar technologies are used on this website for proper function of the website, for tracking performance analytics and for marketing purposes. We and some of our third-party providers may use cookie data for various purposes. Please review the cookie settings below and choose your preference.
Strictly Necessary: Used for the proper function of the website
Performance/Analytics: Used for monitoring website traffic and interactions
Ideally, project managers know better than to execute their project plans without a performancemeasurement baseline. A performancemeasurement baseline provides a window into the project that allows project managers to see roadblocks and resolve them before the project hits a dead end. Learn more.
For a successful project, you need an overall picture of your work performance information (WPI). Performance reporting provides that information by putting performancemeasurement, quality assurance and accountability data in context. There are different targets for performance reporting.
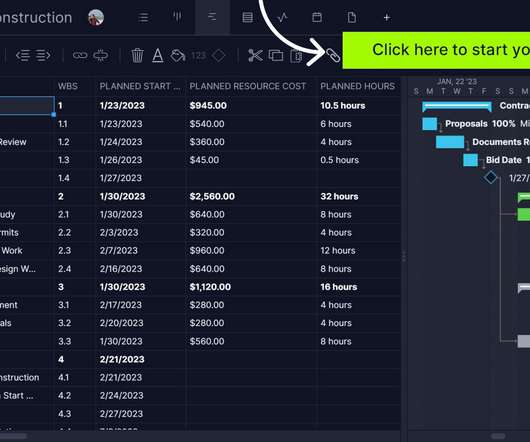
Here are some examples: Budget Milestone schedule Scope baseline Performancemeasurement baseline. We create baselines throughout the project. They represent approved versions of whatever plan they relate to. Baselines will be created and updated as the project progresses and as major changes happen. Visual data and information.
Variance and trend analysis. Technical performancemeasurement. The technical performancemeasurement is a measurement of the technical accomplishments. Reserve analysis. As with many control processes, we now look for variances between the schedule and cost baselines and the actual results.
Scope Earned value analysis (EVA) is a measurement that’s often used for financial performance and progress based on the variance between the planned and actual cost and schedule of the project. Download Word File Resource Resources are another performancemeasurement.
Integration and Ease of Use: Some PMIS will access data from different projects for multi-project analysis, integrating with other systems, such as payroll, inventory, etc. When planning, PMIS helps with detailing the scheduling, including task and critical path analysis. PMIS Throughout the Project Life Cycle.
Use performance metrics analysis and audits to further your understanding of operations and where there is waste and room to improve. You can audit cost centers, list all expenses associated with producing your product, and do a root cause analysis. You can’t improve what you don’t know. Share Information with Employees.
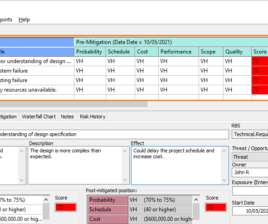
Variance and trend analysis As with many control processes, we now look for variances between the schedule and cost baselines and the actual results. Technical performancemeasurement Imagine that you are working on a software development project and that the functional requirements have been developed.
Here are some examples: Budget baseline Milestone schedule Scope baseline Performancemeasurement baseline. Baselines We create baselines throughout the project. They represent approved versions of whatever plan they relate to. The point of having visual data sources is that they make it easier to understand the information.
Please find below a transcription of the audio portion of Fletcher Hearn’s session, Project PerformanceMeasurement – Part 1: Overview Of Project PerformanceMeasurements, being provided by MPUG for the convenience of our members. Kyle: Hello, and welcome to part one of MPUGs Project PerformanceMeasurement course.
All project progress is measured independent of resources expended - Mr. Gary Bliss, Director Performance Assessment and Root Cause Analysis (PARCA), US Department of Defense. This bounding of the cost estimate may be attempted through sensitivity analyses or through a formal quantitative risk analysis.
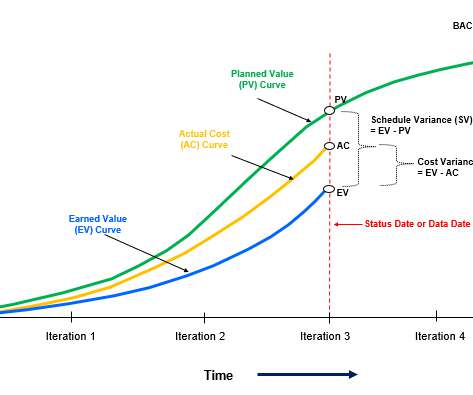
Actual Cost (AC) is the cost incurred while performing the activity or cost of work performed on an activity during a specific time period. Microsoft Project as a tool can help project managers to perform Earned Value Analysis and Earned Value Management for their projects. EVM Importance. EVM in Microsoft Project.
Keep reading for my analysis and reviews of the best PMI-ACP prep books that will help you understand agile methodologies and earn your agile certification. I read and review a lot of books, so I feel confident recommending these to you! I also speak to a lot of authors and have met many project management trainers over the years.
Conduct a Variance Analysis. The results of the variance analysis are included in the Final Report of the project. Variance and Variance Analysis are two separate, but intertwined terms. As noted in the definition of variance analysis, a comparison is always with respect to the latest baseline.
Business Analysis A process in which an individual identifies business needs, defines solutions and facilitates change to meet organizational goals. Cost-Benefit Analysis A method is used to assess a project’s potential benefits compared to its costs to determine if the project is worth doing. It is also known as the 80-20 rule.
Please find below a transcription of the audio portion of Fletcher Hearn’s session, Project PerformanceMeasurement – Part 3: Using MS Project to Track and Report on Performance, being provided by MPUG for the convenience of our members. This one’s titled using MS Project to track and report on performance.
Misaligned Incentives : Tying management incentives to traditional performancemeasures incompatible with Scrum or agile principles. I should consider this analysis of the origins of the gold-plating anti-pattern for the next revision of the book.)
Process Improvement Tool #1: Gap analysis. Gap analysis examines and assesses performance to identify the difference between your current business state and where you’d like to be. To complete a gap analysis, you’ll need to define: The current situation, or performance. The ideal situation, or potential.
PerformanceMeasurement Baseline. This creates a point of comparison of all the other baselines to evaluate project performance. Techniques/Analysis/Tools. This network analysis technique uses the Monte Carlo simulation to formulate project duration estimates and give a probabilistic approach to visualize network logic.
Decision Analysis is a principle, technique, and application to address complex decisions in a structured manner. One approach to decision making utilizes a form of multi-criteria decision analysis to evaluate multiple conflicting criteria in decision making. 3] “Measurement Scales and Statistics: The Misconception Misconceived,” J.
Project Performance Management. Connecting the 5 Principles and 5 Practices of Performance-Based Project Management ® To Increase the Probability of Project Success. Building a Credible PerformanceMeasurement Baseline. Measures of Product Value is Exchange for Its Cost. Technical PerformanceMeasures.
I work in the Software Intensive System of Systems domains in Aerospace, Defense, Enterprise IT (both commercial and government) applying Agile, Earned Value Management, Productive Statistical Estimating (both parametric and Monte Carlo), Risk Management, and Root Cause Analysis with a variety of capabilities. A Few References and Resources
It covered identifying requirements, interconnecting tasks, resources, planned values, actual values, baselines, performancemeasures, forecast techniques and timesheets. A tiny snapshot of the analysis that the different software tools went through. The Future: Software Supporting Faster and Iterative Working.
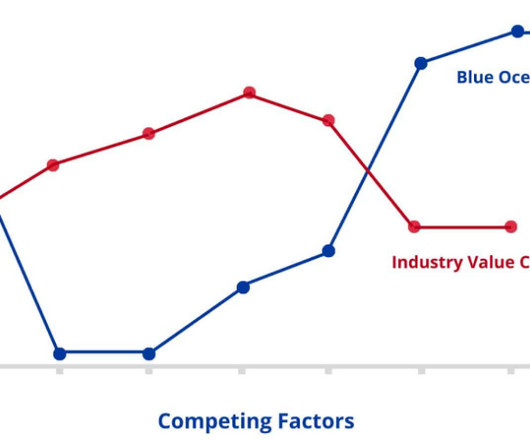
Here are some situations when it’s beneficial to use the Strategy Canvas: Strategic Analysis: Use the Strategy Canvas to analyze your company’s competitive positioning relative to competitors. It helps identify areas where your company excels and areas where there is room for improvement.
Procurement planning involves the make or buys analysis to decide whether to procure or to make in-house. Perform Qualitative Risk Analysis . Perform Quantitative Risk Analysis . The performancemeasurement data that is sent out to stakeholders comes from this phase. . Plan Cost Management .
Project Performance Management (#PPM). Technical PerformanceMeasures (#TPM). Cost, Schedule, and Technical Performance Management (#CSTPM). Project Performance Management. Building a Credible PerformanceMeasurement Baseline - without a good foundation, nothing can be built. Risk Management (#RM).
In-depth Analysis of Selected Risk Management Frameworks When it comes to risk management, organizations have several frameworks to choose from. It offers a holistic approach, covering various aspects such as strategic alignment, value delivery, resource management, risk management, and performancemeasurement.
At times I work for the Institute for Defense Analyses , who produces Root Cause Analyses for software-intensive system of systems, here's an example Expeditionary Combat Support System: Root Cause Analysis. Start with Root Cause Analysis and only then suggest the reason for the problem. Related articles. IT Risk Management.
Like nearly every observed problem, there is some underlying cause and Root Cause Analysis is the first step in assessing this undesirable condition to determine if it is correctable or preventable. Any successful technical communication needs to have: Measures of Effectiveness. Measures of Performance.
A robust PM system might tell you how a project is doing at any moment, but it can’t tell you how the organization or its constituent people are performing. Measuring and monitoring project management metrics fills this gap. Any metric you measure should be clearly and accurately measurable.
Of course, No Root Cause analysis has been performed by these advocates, but it makes good click bait for their followers. This approach is guided by the processes for Root Cause Analysis on Software Intensive System of Systems project I've worked. Root Cause Analysis. Getting it Right. Court Document. Assessment.
The Cone of Uncertainty as a Technical PerformanceMeasure. In our domain, Root Cause Analysis is mandated before ANY suggested change for improvement, prevention, or corrective actions are taken. The Cone of Uncertainty as a Technical PerformanceMeasure. Measure of Effectiveness. Measure of Performance.
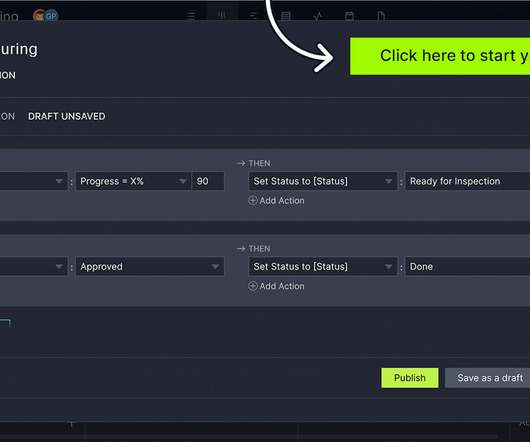
When project management software gets an updated data analysis regarding monthly budget and performancemeasurement baseline (PMB) from EVM systems, you can proceed to the next level with ease. ? Accounting and Cost Analysis. Creating Management Reports and Analysis. Revision and Data Maintenance.
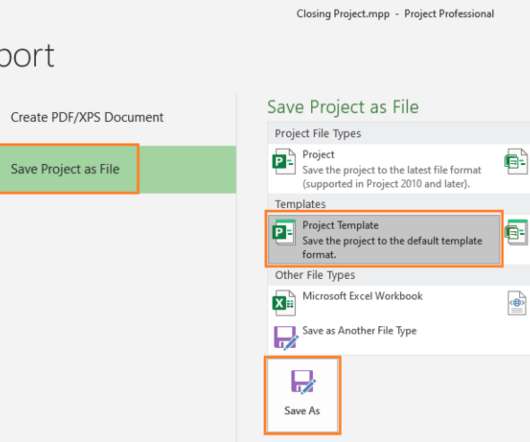
Schedule Baseline as a Performance Baseline Component . It’s a component of a performancemeasurement baseline that consists of scope, schedule, and cost baselines and is included into a project plan. A schedule baseline, aka baseline schedule, is a copy of a planned project schedule approved by stakeholders.
At the start of each iteration, he may be unsure about the applicability of earned value analysis, measurement, and management within Agile. With frequent scope changes, how does one determine what to measure against? In EVM terminology, baseline is further defined as the performancemeasurement baseline (PMB).
It can be the needed performance of a measure - Effectiveness, Performance, Key Performance Parameter, or a Technical PerformanceMeasures. The specifics of the Technical PerformanceMeasures applied to inform Physical Percent Complete and the Cone of Uncertainty around the TPM are shown here.
Earned Value Management (EVM): EVM is a project performancemeasurement technique that integrates cost, schedule, and scope data to assess project performance and forecast future performance. Techniques include change request forms, change impact analysis, and change control boards to review and approve changes.
Source: Unsplash Marketing operations professionals are responsible for managing the processes, systems, and technologies that support marketing initiatives, such as project management, budgeting, data analysis, campaign execution, and performancemeasurement.
Here are some ideas: Market Analysis – Before formulating a strategy, a strategist analyzes the market to identify existing competition, market trends, and customer needs. Impact of Value Innovation on Strategy Value innovation, as part of the Blue Ocean approach, is part of an overall strategic framework.
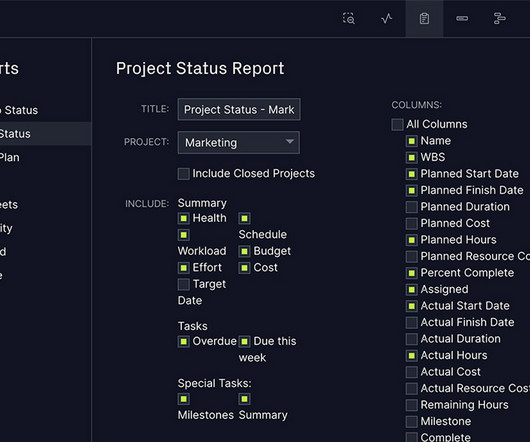
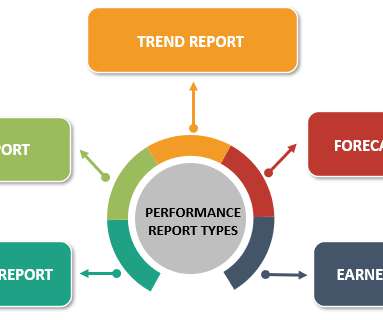
What is performance reporting? Performance reporting is the process of collecting and analyzing data about a company's performance. Performance reports provide an in-depth analysis of how well the company has done over time, its strengths, and weaknesses, and how it compares to other companies in its industry.
What is performance reporting? Performance reporting is the process of collecting and analyzing data about a company's performance. Performance reports provide an in-depth analysis of how well the company has done over time, its strengths, and weaknesses, and how it compares to other companies in its industry.
Simplify metrics for better understanding: Overcomplicating the metrics used in the Balanced Scorecard can lead to confusion and hinder effective performancemeasurement. To avoid this, organizations should focus on identifying the most critical indicators that drive performance.
Key Performance Parameters (KPP) – Represent the capabilities and characteristics so significant that failure to meet them can be cause for reevaluation, reassessing, or termination of the program. KPPs have a threshold or objective value that characterize the major drivers of performance that are considered Critical to Customer (CTC).
Do they characterize the major drivers of performance? Are the Technical PerformanceMeasures stated in units that can determine how well the systems or system element is satisfying or expected to satisfy a technical requirement or goal? Estimating Processes in Support of Economic Analysis. Related articles.
We organize all of the trending information in your field so you don't have to. Join 100,000+ users and stay up to date on the latest articles your peers are reading.
You know about us, now we want to get to know you!
Let's personalize your content
Let's get even more personalized
We recognize your account from another site in our network, please click 'Send Email' below to continue with verifying your account and setting a password.


Let's personalize your content